

Nope, this isn’t a blog about time travel, quantum physics, or Doctor Strange bending reality…
But we are going to mess with the fabric of your PowerShell universe today! 😉
You ever have one of those moments where your PowerShell script is almost working?
Variables are behaving, pipelines are smooth, logic is clean and then BAM…
Something breaks. Something small. Something stupid.
And suddenly you’re staring at your screen like:
“Why. Just… why?”
So now you’re sprinkling Write-Host everywhere like it’s confetti, or dropping random output just to see where things went wrong. Before you know it, your once-beautiful script looks like a cyberpunk Christmas tree. 🎄💻
But… what if I told you PowerShell has a built-in debugging feature that lets you pause your script exactly where you want, inspect variables, step through code, and basically feel like you’re operating a high-tech surveillance system?
No extra tools. No extensions. No magic wands.
Sounds like we’re back in control, right?
Well, that’s exactly what we’re diving into today! We’ll be talking about Set-PSBreakpoint, the PowerShell equivalent of putting laser tripwires inside your own code.
💡 I will always recommend using Visual Studio code or any other IDE with debug functionality for debugging (as this is way easier). But when you have your scripts published somewhere where there is no IDE available this might be a good trick to still do debugging.
🎬 See this one? Time to stop relaxing and get your hands dirty!
📒 This one? Well, this one is there for highlighting things to you. Whether I believe extra information is required about a section, I’ll post it here.
Enough smooth talk! Let’s get started!
What is Set-PSBreakpoint?
At its core, Set-PSBreakpoint is one of those features in PowerShell that makes you wonder why you ever tortured yourself with random Write-Host debugging in the first place. Instead of scattering print statements all over your script like breadcrumbs, breakpoints let you pause execution exactly where you want and inspect what’s really going on.
With Set-PSBreakpoint, you can tell PowerShell things like:
- “Hey, stop right here when this line runs.”
- “Pause whenever this variable changes.”
- “Freeze time when this specific function gets called.”
It’s like giving PowerShell a “tripwire” and telling it:
“When this happens, HOLD IT RIGHT THERE.”
And here’s the cool part: once the breakpoint triggers, PowerShell drops you straight into the debugger. From there, you can look at variables, step through your code, run additional commands, and basically poke around like you’re in a lab coat and goggles 🧪.
So whether you’re troubleshooting a misbehaving loop, tracking a sneaky variable mutation, or trying to understand why your function occasionally decides to take a nap, breakpoints let you debug with precision and without the chaos of temporary log statements.
In short: if you want your script to behave like a first-class citizen while you play detective, Set-PSBreakpoint is your new best friend. 😉
Getting Started
So, we now have the basic introduction to PowerShell Debugging, let’s get started!
🎬 Follow the steps below
📒 This is done in PowerShell 7+, I haven’t been testing out 5
- Create two scripts in a directory “SampleScript.ps1” and “Debugger.ps1”
- Provide sample.ps1 the code below
function Test-Function {
    $a = 10
    $b = 20
    $c = $a + $b
    Write-Host "Result: $c"
    return $c
}
Test-Function- Provide the Debugger.ps1 file with the code below
$scriptPath = Join-Path $PSScriptRoot "SampleScript.ps1"
$absoluteScriptPath = (Resolve-Path $scriptPath -ErrorAction SilentlyContinue).Path
if (-not $absoluteScriptPath) {
    $absoluteScriptPath = (Get-Item $scriptPath).FullName
}
try {
    $bp = Set-PSBreakpoint -Script $absoluteScriptPath -Line 4
    $bp | Format-List Id, Script, Line, Enabled
} catch {
    Write-Host "❌ Error creating breakpoint: $_" -ForegroundColor Red
}

$currentBps = Get-PSBreakpoint
if ($currentBps.Count -gt 0) {
    $currentBps | Format-Table Id, Script, Line -AutoSize

    try {
        & $absoluteScriptPath
    } catch {
        Write-Host "`nScript execution completed or was interrupted." -ForegroundColor Gray
    }
} else {
    Write-Host "No breakpoints currently active." -ForegroundColor Yellow
}💡 See this line: “$bp = Set-PSBreakpoint -Script $absoluteScriptPath -Line 4“ We are specifically targeting line 4 for the debugger
Let’s debug!
Now open a PowerShell session to the directory containing the files and lets get debugging.
🎬 Run the debugger script by dot sourcing the file
- .’debugger.ps1’
You should see the result below
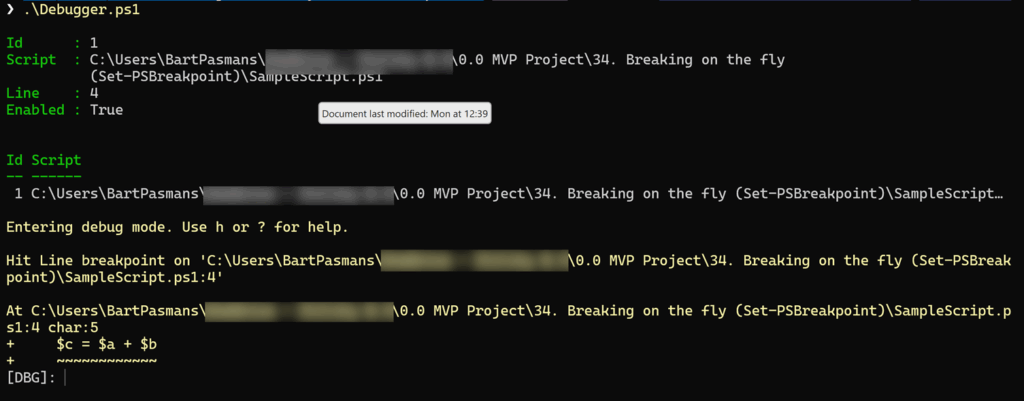
As you can see by the ‘[DBG]’ we’ve now hit debug mode and can use various controls to continue the debug process. Some of those I’ve summarized below:
C – Continue:
Tells PowerShell to run normally until it hits the next breakpoint (or finishes the script).
Think of it like pressing the play button.
S – Step Into:
Moves to the next line and jumps inside any functions being called.
Perfect when you want to see exactly what a function is doing.
V – Step Over:
Runs the current line but does NOT go inside functions.
If a line calls a function, PowerShell executes it quietly and moves on.
O – Step Out:
If you’re inside a function, this finishes it and returns you back to where it was called.
Like saying, “Take me back up a level.”
K – Call Stack:
Shows the chain of functions that led to this point.
Great for understanding the path of execution.
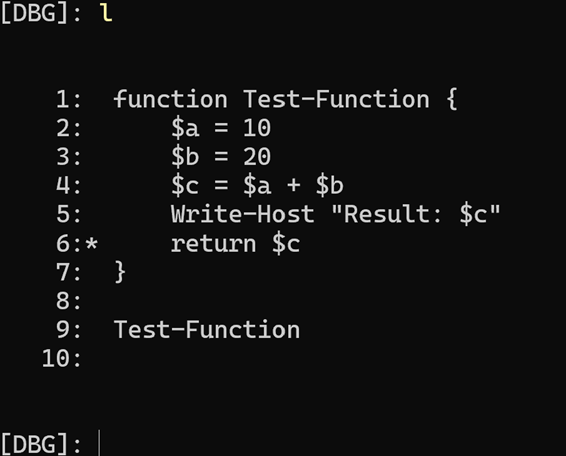
l – List Source Code:
Prints the nearby lines of code so you know where you are.
It’s basically your mini-map in the debugger which you can now use to check what is going wrong in your script!
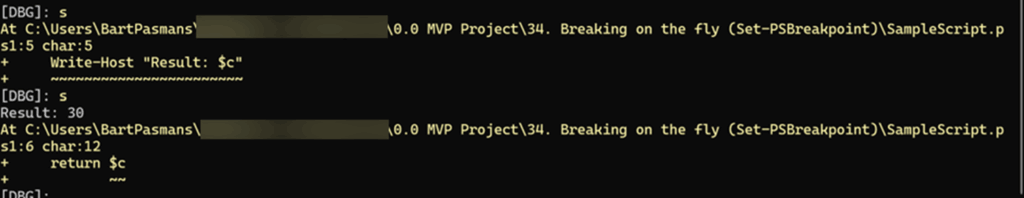
First step into:
🎬 Press S and hit Enter. This tells the debugger, “Alright, take me inside every little detail!”
Each time you press S, the debugger moves forward one instruction at a time, diving into functions, scripts, and anything callable. It’s like walking through a haunted house with a flashlight—you’re not skipping anything; you’re exploring every room, corner, and creaky floorboard.
Every tap of S continues your journey deeper into the code, letting you inspect what’s happening behind the scenes with microscopic precision.
List source code:
🎬 Press S and hit Enter.
This tells the debugger: “Let’s go inside and see exactly what’s happening here!”
Using S makes PowerShell step into the next line of code, and if that line calls a function, it jumps inside that function so you can watch every detail unfold.
Each time you press S, the debugger advances one small step deeper into execution, giving you full, microscopic control of what’s happening in your script.
This way you can immediately see what code is running when the debugger hits! Cool right?! This gives you some easy to use tools for debugging long scripts where you want to dive into by a step-by-step approach.
Go test the other input parameters as well and see what happens 😉
Interesting resources:
Before you ride off into the debugging sunset, here are some extra gems worth checking out. These links, docs, videos, and deep dives will sharpen your PowerShell debugging skills, open new rabbit holes to explore, and give you those “ohhhh, that’s how it works!” moments. Whether you’re a curious beginner or a seasoned scripter looking for secret techniques, these resources will keep your PowerShell brain happily buzzing. Dive in, click around, and supercharge your script-fu! 🚀📖
Set-PSBreakpoint (Microsoft)
Debugging Explained (Microsoft)
John Savill (not using Set-PSbreakPoint, but amazing debug explanation)
Summary
We covered PowerShell debugging today, and no, we didn’t bend time, summon Doctor Strange, or open a wormhole in the multiverse…
But we did learn how to stop PowerShell dead in its tracks and poke around like curious digital detectives.
Here’s what you walk away with:
🎯 You learned what Set-PSBreakpoint really is:
A built-in PowerShell tripwire that lets you freeze execution exactly where you want, without cluttering your script with Write-Host sprinkles.
🧨 You created your own debugging setup:
Two simple scripts, one that runs, one that rigs the trap, and suddenly you’ve got breakpoints firing like laser sensors in a spy movie.
🛑 You hit the breakpoint and entered the debugger:
That magical [DBG]: prompt where PowerShell hands you the keys to the kingdom and says:
“Go ahead… inspect everything.”
🎮 You mastered the core debugger controls:
🔍 You stepped through your code with confidence:
Using S felt like exploring a haunted house with a flashlight, no room skipped, no creaky floorboard ignored.
Using L gave you instant awareness of where you were and what was coming next.
🎉 And best of all:
You now have real debugging power. No more messy Write-Host confetti explosions.
No more guessing.
No more “why… just why” moments.
Just clean, controlled, laser-precise insight into your script.
So go ahead, break things on purpose.
Set traps in your code.
Step through it like a pro.
And have fun doing it. 😉
Happy debugging! 🐛💥