
If you’ve been following my blog, you know I’m passionate about automation, observability, and building maintainable PowerShell solutions. Today, we’re diving into something that every advanced scripter should use, but very few even know exists: PowerShell tracing!
Yes, we all write logs.
Some of us write too many logs.
But what if I told you PowerShell has a built-in diagnostic engine capable of producing deep-level insights into modules, cmdlets, providers, and internal pipelines… without modifying a single line of your code?
Let me introduce:
🎯 Set-TraceSource – your hidden superpower for debugging, auditing, and understanding PowerShell internals.
In this blog, we’re going to explore:
- What tracing is and why it matters
- How Set-TraceSource enables real-time diagnostics
- Practical examples for troubleshooting
- How to build your own trace listeners
- Tips to integrate this into production automation
Let’s debug smarter, not harder. 🔧✨
During this post, you’ll see this icon 🎬, which means action is required so you can try it yourself.
And you’ll see 📒 when I’m explaining the underlying concepts and internals.
When to Utilize This
Most engineers are familiar with traditional logging: Write-Verbose, Write-Debug, or custom logging frameworks sprinkled throughout scripts. These tools are helpful, but they all have one key limitation, they only capture what you remembered to log. Miss a spot, and you’re left guessing what happened.
PowerShell tracing with Set-TraceSource works differently. It taps directly into the engine itself, giving you automatic, real-time insight into modules, cmdlets, providers, and pipelines, no code changes required. Suddenly, you’re not just logging messages; you’re observing the inner workings of PowerShell as it executes, step by step, in a way that no verbose or debug message can match.
Set-TraceSource works differently.
It traces PowerShell itself, including:
- Cmdlet internals
- Module loading behavior
- Script execution flow
- Providers (FileSystem, Registry, Environment)
- Pipeline execution
- Host interactions
So why use tracing?
Traditional Debugging Problems
• 🔴 You only get logs for what you remembered to log
• 🔴 Difficult to debug 3rd-party or system modules
• 🔴 Verbose/Debug messages require modifying scripts
• 🔴 Hard to audit cmdlet-level behavior
• 🔴 No centralized view of internal engine activity
Set-TraceSource solves these cleanly:
• ✅ No code changes required
• ✅ Trace internal PowerShell events
• ✅ Debug any module, even Microsoft-built ones
• ✅ Understand pipeline events at the engine level
• ✅ Capture detailed messages for audits
• ✅ Enable/disable tracing without editing scripts
📒 Use cases:
PowerShell tracing is perfect for:
- Troubleshooting slow scripts
- Reverse-engineering module behavior
- Tracking file system operations via providers
- Learning internals of complex automations
- Security auditing of script behavior
- Understanding how a cmdlet executes
It’s an incredibly powerful diagnostic tool hiding in plain sight.
Setting Up Tracing
Now that we’ve seen what PowerShell tracing is and why it’s so powerful, it’s time to actually use it. Tracing is like opening a window directly into the PowerShell engine, you can watch cmdlets being discovered, parameters being bound, pipelines being processed, and even how output formatting transforms objects.
By enabling specific trace sources, you get live, real-time insight into what the engine is doing behind the scenes. No guessing, no adding debug statements, just a direct view into PowerShell’s inner workings.
Lets start!
🎬 Discover Available Trace Sources
- Run the following command:
Get-TraceSource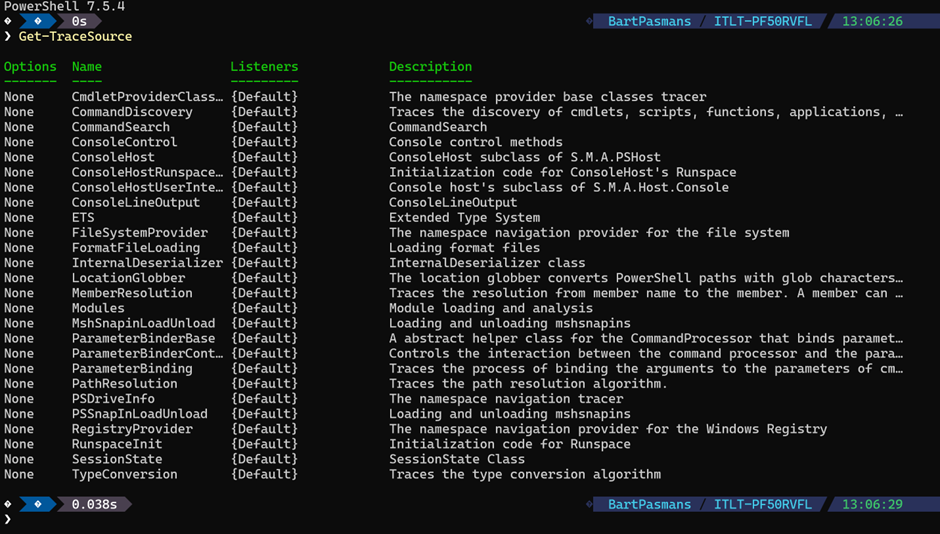
You’ll see dozens of internal components you never realized existed.
📒 This shows registered sources inside the PowerShell engine.
Every source corresponds to a subsystem that emits structured diagnostic events.
- Now run the command below
Set-TraceSource -Name ParameterBinding -Option ExecutionFlow -PSHost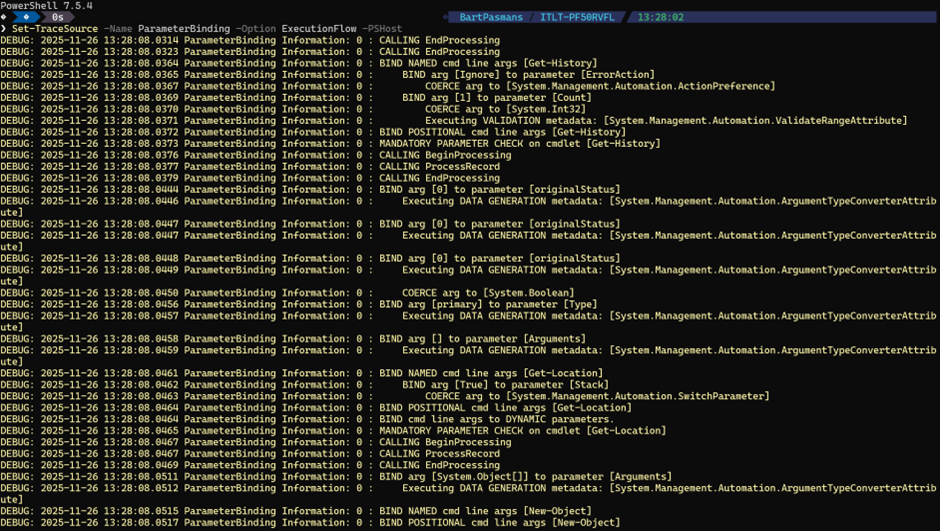
💡 You might not see it, but PowerShell is waiting for you right now to supply it with a command it needs to run.
Enter for instance
$currentDate = Get-Dateand run
You will now see that the command gets executed:
It now shows you with all steps what it’s doing to get to the result.
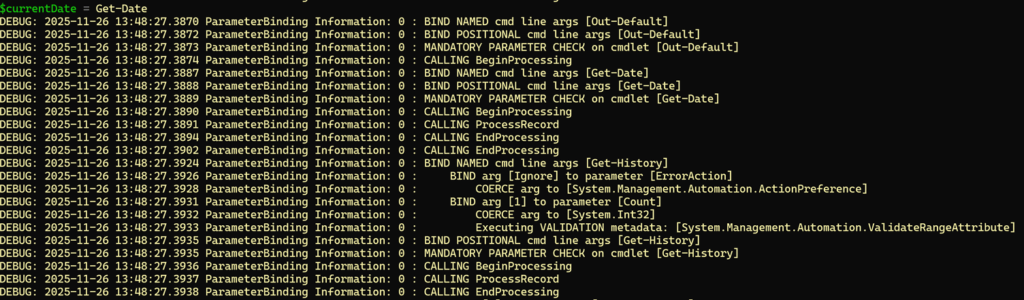
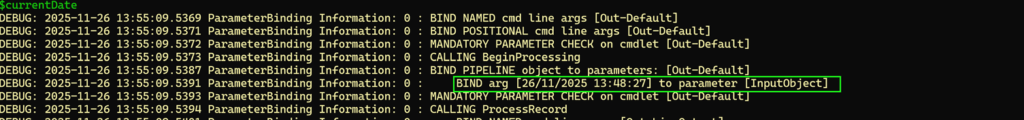
Now enter
$currentDateand press enter
You will see in the output that the binding of the variable is happening and that the value of the variable is fetched and stored in the variable:
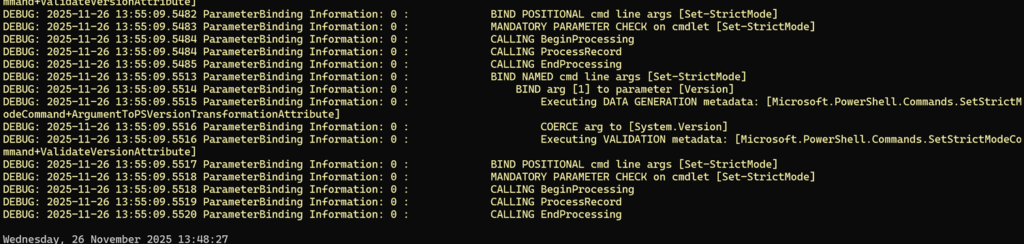
When the process is done you’ll see the output presented
Did you see? The output is different! That’s because [Format-Default] gets hit:
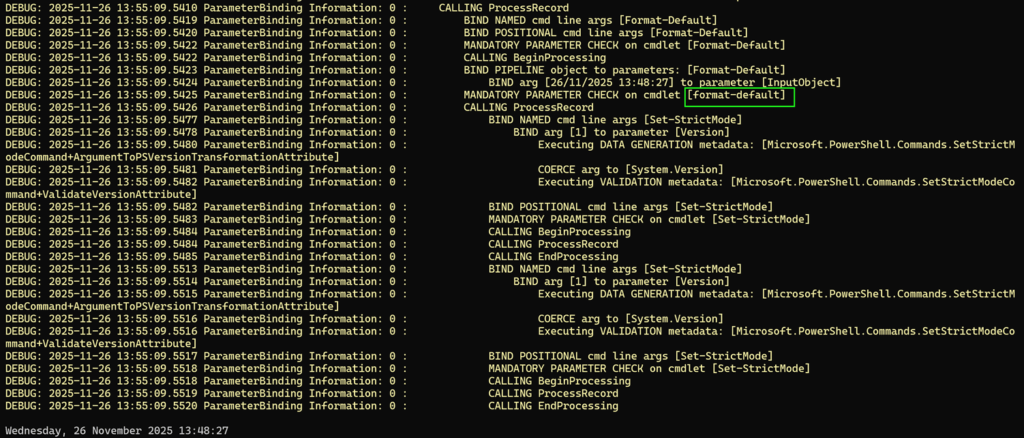
This basically transforms the output to the output we are seeing which by default is ‘long datetime’ So, try to run it for some of your scripts! You can dot source them and see the output in a similar way, this way you can even run your big scripts in a way so you still get the debugging trails with Set-TraceSource!
Microsoft has good documentation available which you can find here:
Summary
That’s a wrap! 🎉
In this blog, we explored how to unlock PowerShell’s hidden diagnostics engine using Set-TraceSource, the built-in way to trace cmdlets, modules, providers, and pipeline internals without changing a single line of your scripts.
We kicked things off by looking at why traditional debugging (Write-Verbose, Write-Debug, custom logs) only gives you part of the picture, and how tracing lets you see what PowerShell is really doing under the hood. Then we jumped into hands-on examples and:
✅ Discovered all available engine trace sources with Get-TraceSource
✅ Enabled real-time tracing for parameter binding and pipeline execution
✅ Watched PowerShell resolve commands, bind variables, and format output
✅ Learned how providers, cmdlets, and the formatting engine emit structured trace events
✅ Saw how tracing gives full internal visibility with zero code changes
🎬 If you followed along step-by-step, you should now be able to observe exactly how PowerShell processes your commands, from binding to execution to formatting, all streamed live through your host.
📒 This post is all about gaining observability and debugging superpowers without touching the scripts you’re inspecting. Tracing helps troubleshoot performance issues, reverse-engineer module behavior, and understand the engine’s decisions with full transparency.
Thanks again for reading!
I hope this inspires you to use PowerShell tracing in your own automation, whether to debug performance issues, analyze third-party modules, or simply understand the engine better.
Let me know what you discover! 🚀